Enterprise Transportation Analytics Application
Overview
The Enterprise Transportation Analytics Application, (ETA), is an application used by USPS plant facility managers to gather information an analytics concerning the resources and vehicles used to transport mail.
The Problem
Through research and discovery methods, areas of the application where found to be problematic and inefficient from a usability aspect, such as visibility issues and ability to properly locate data.
UX Deliverables
• Research Plan
• Usability Testing
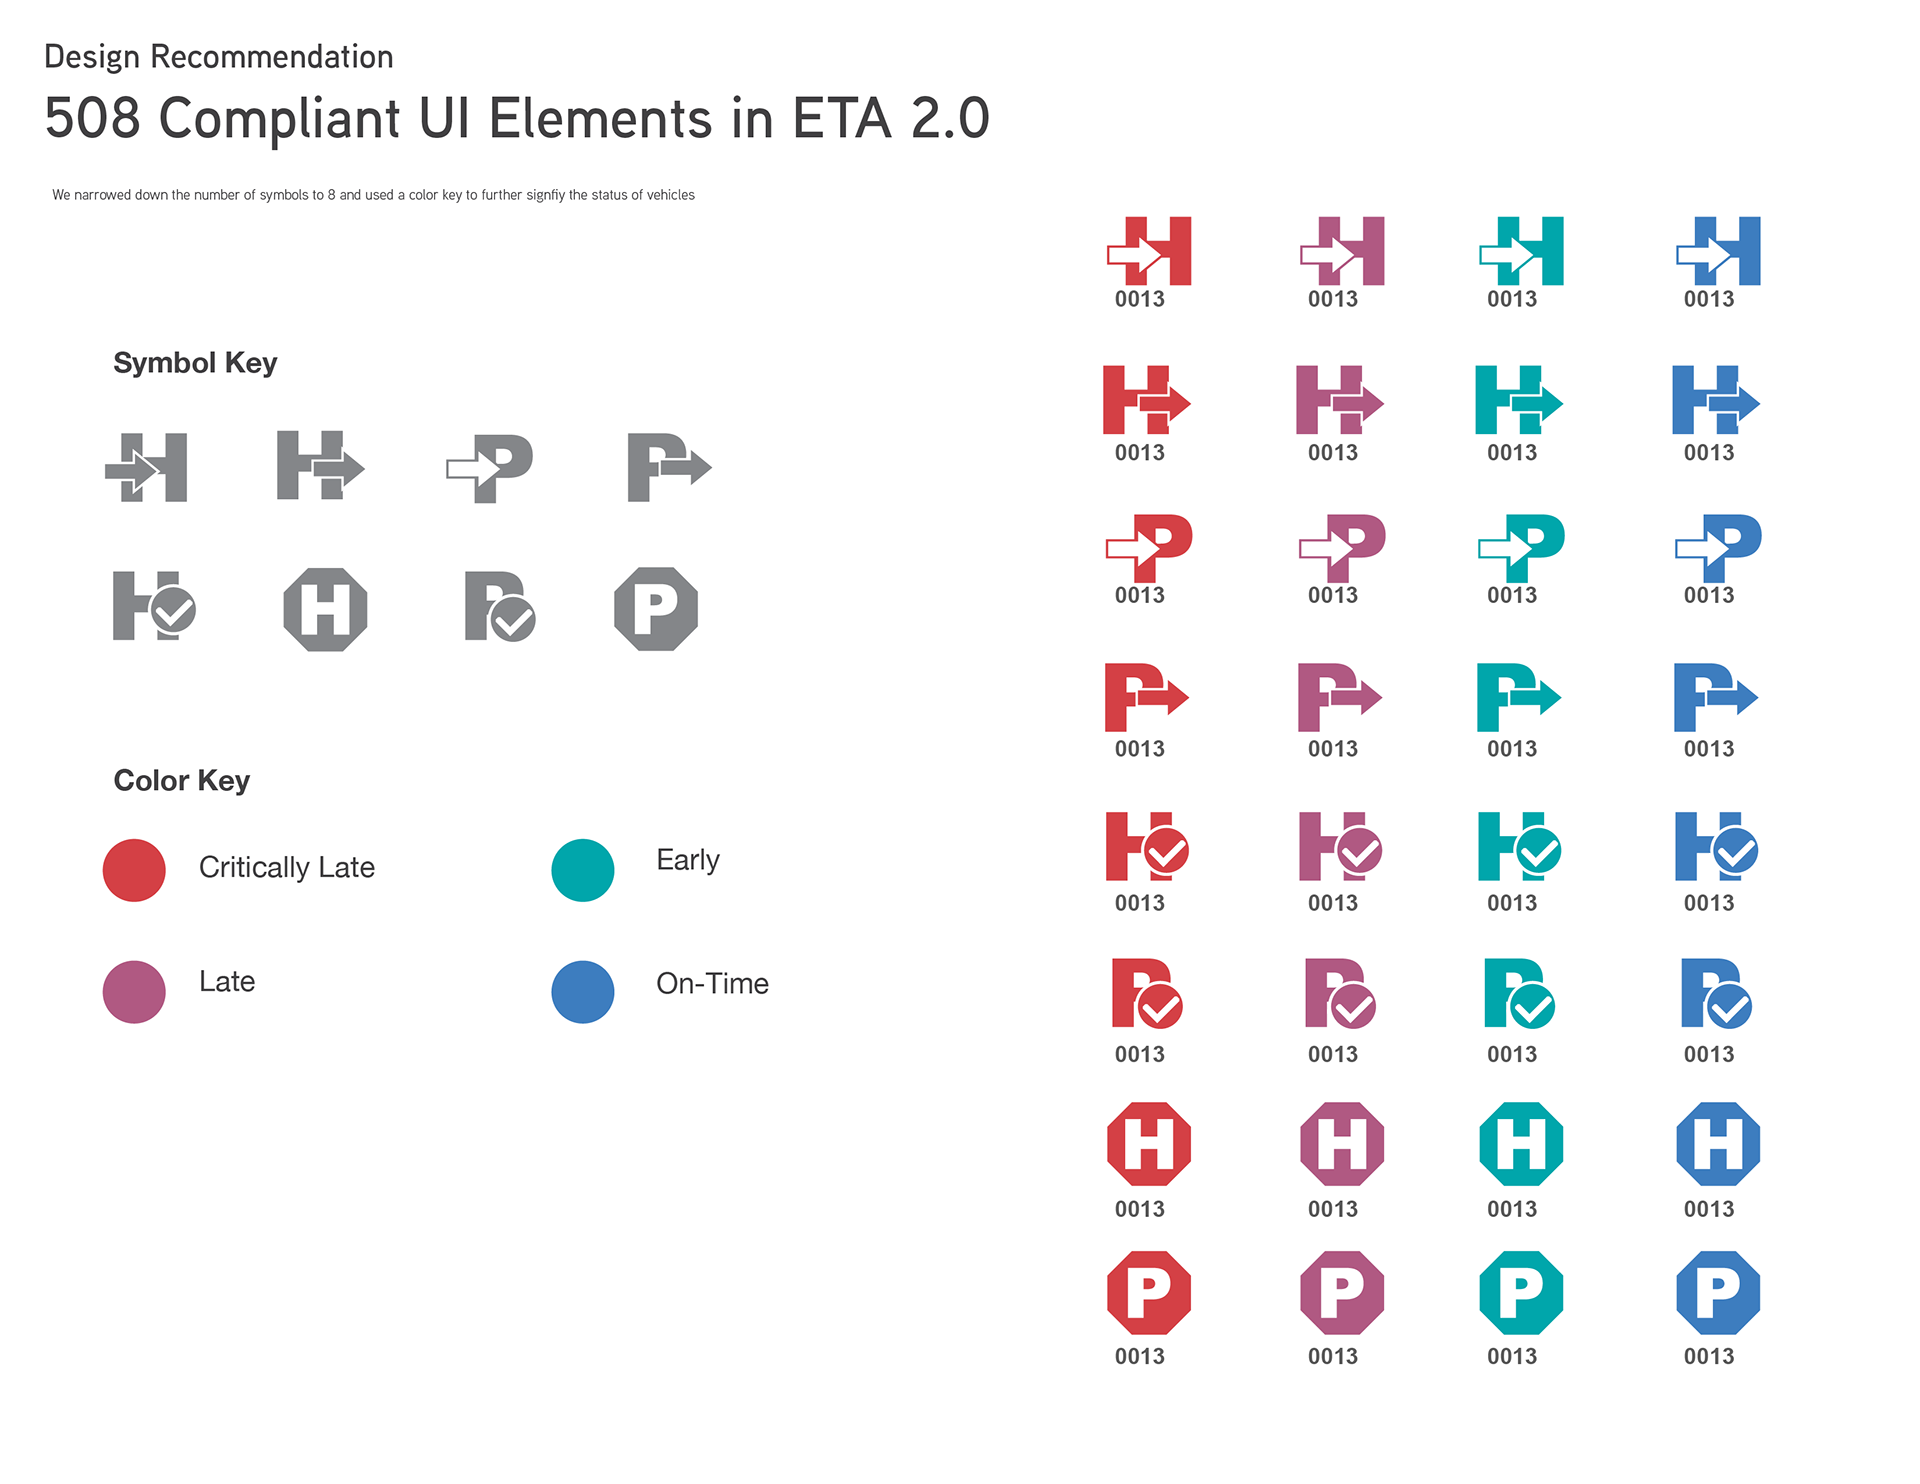
• 508 Compliant UI
• Interactive Prototype
• Usability Testing
• 508 Compliant UI
• Interactive Prototype
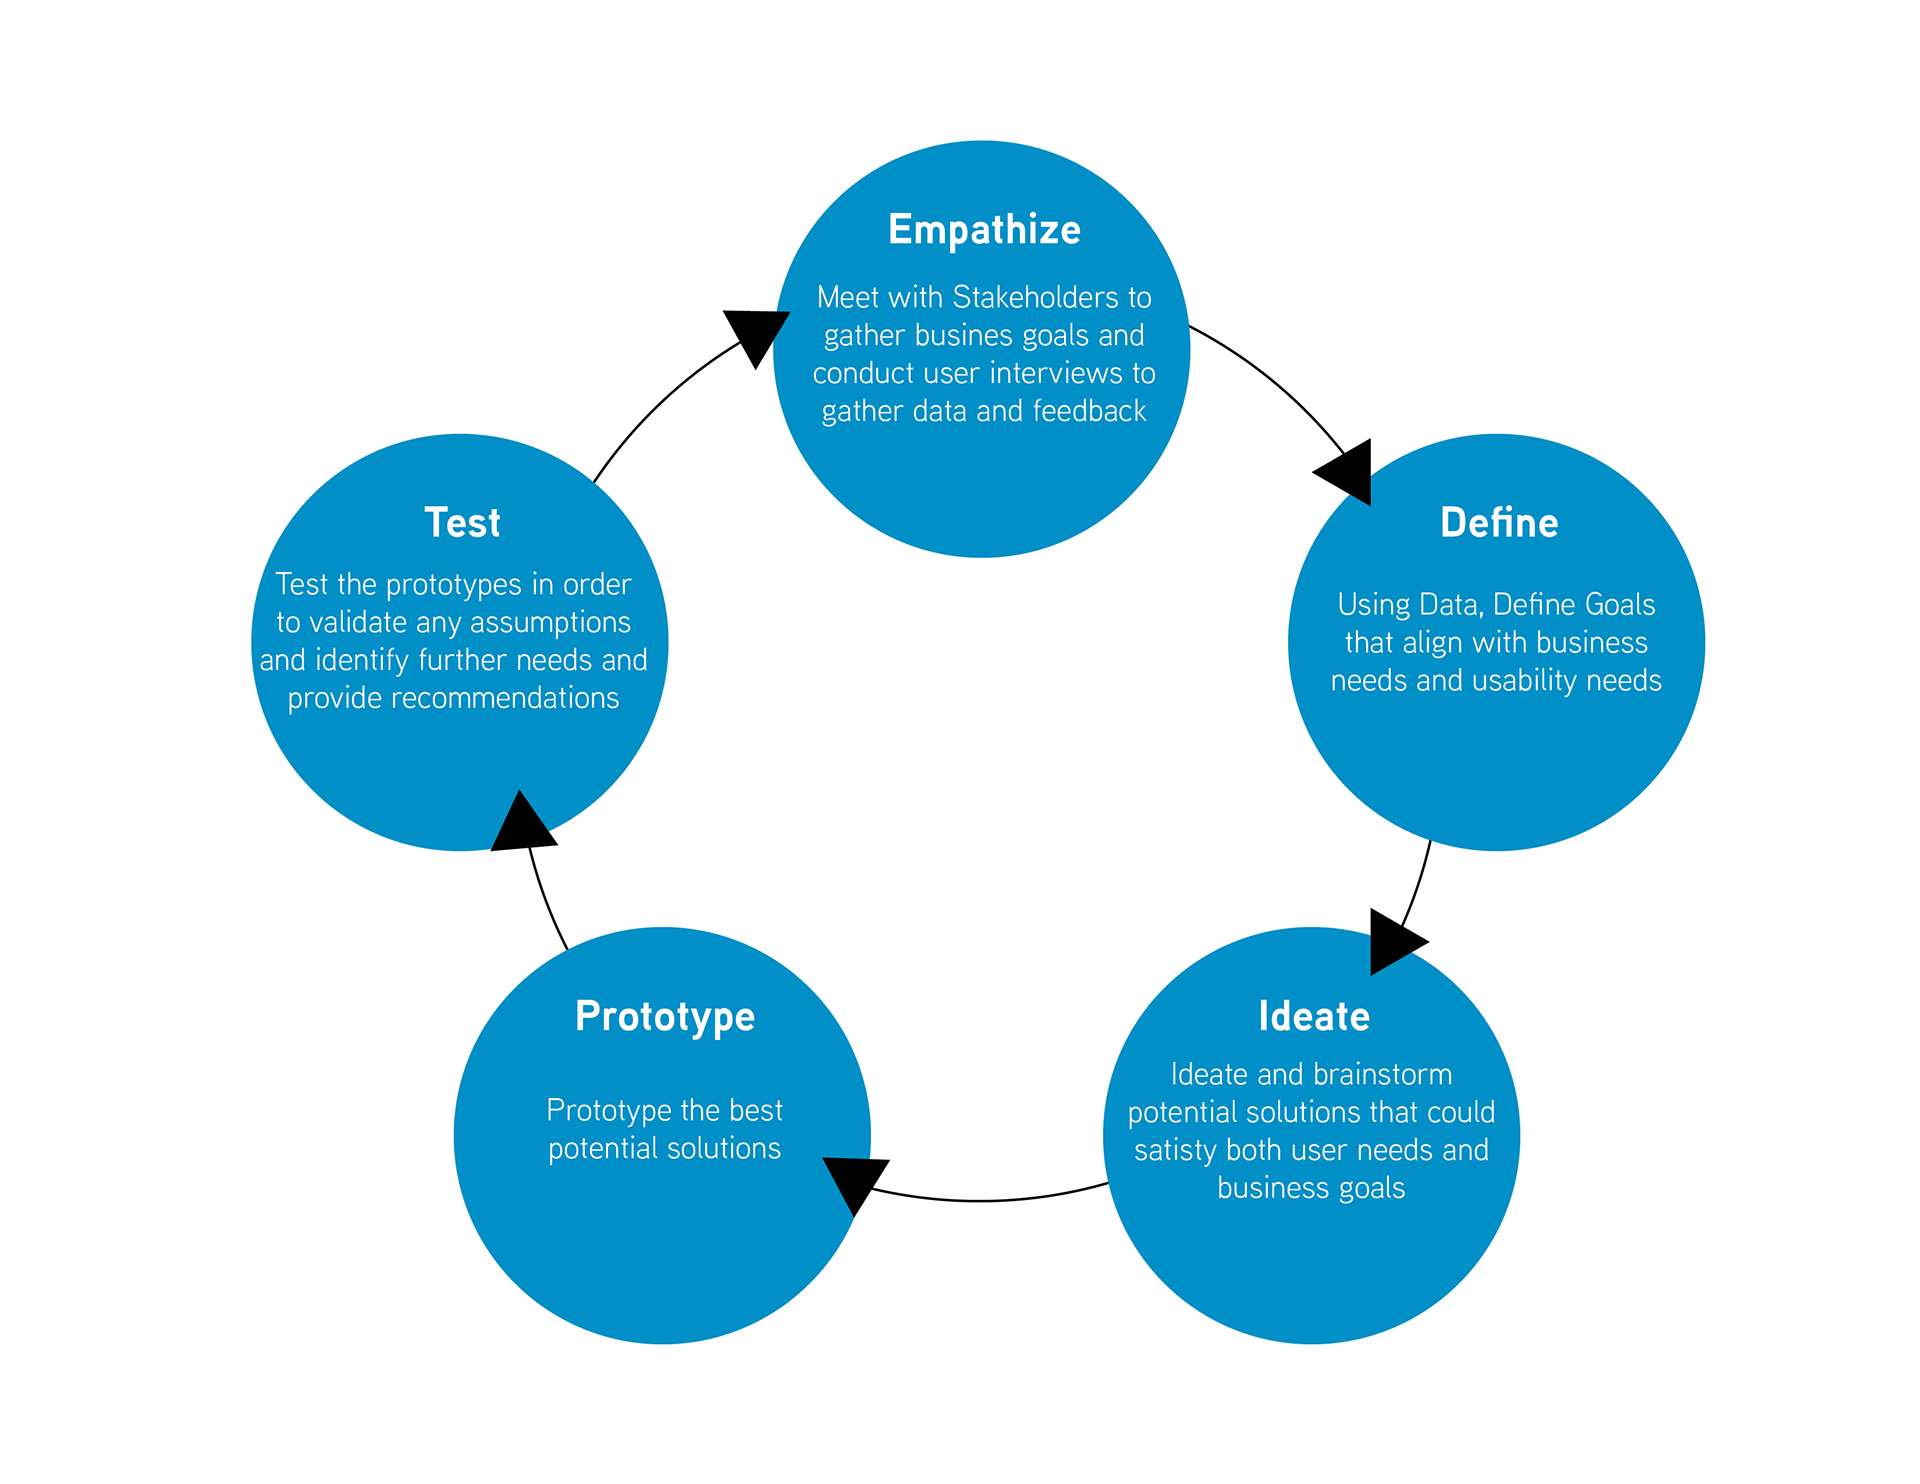
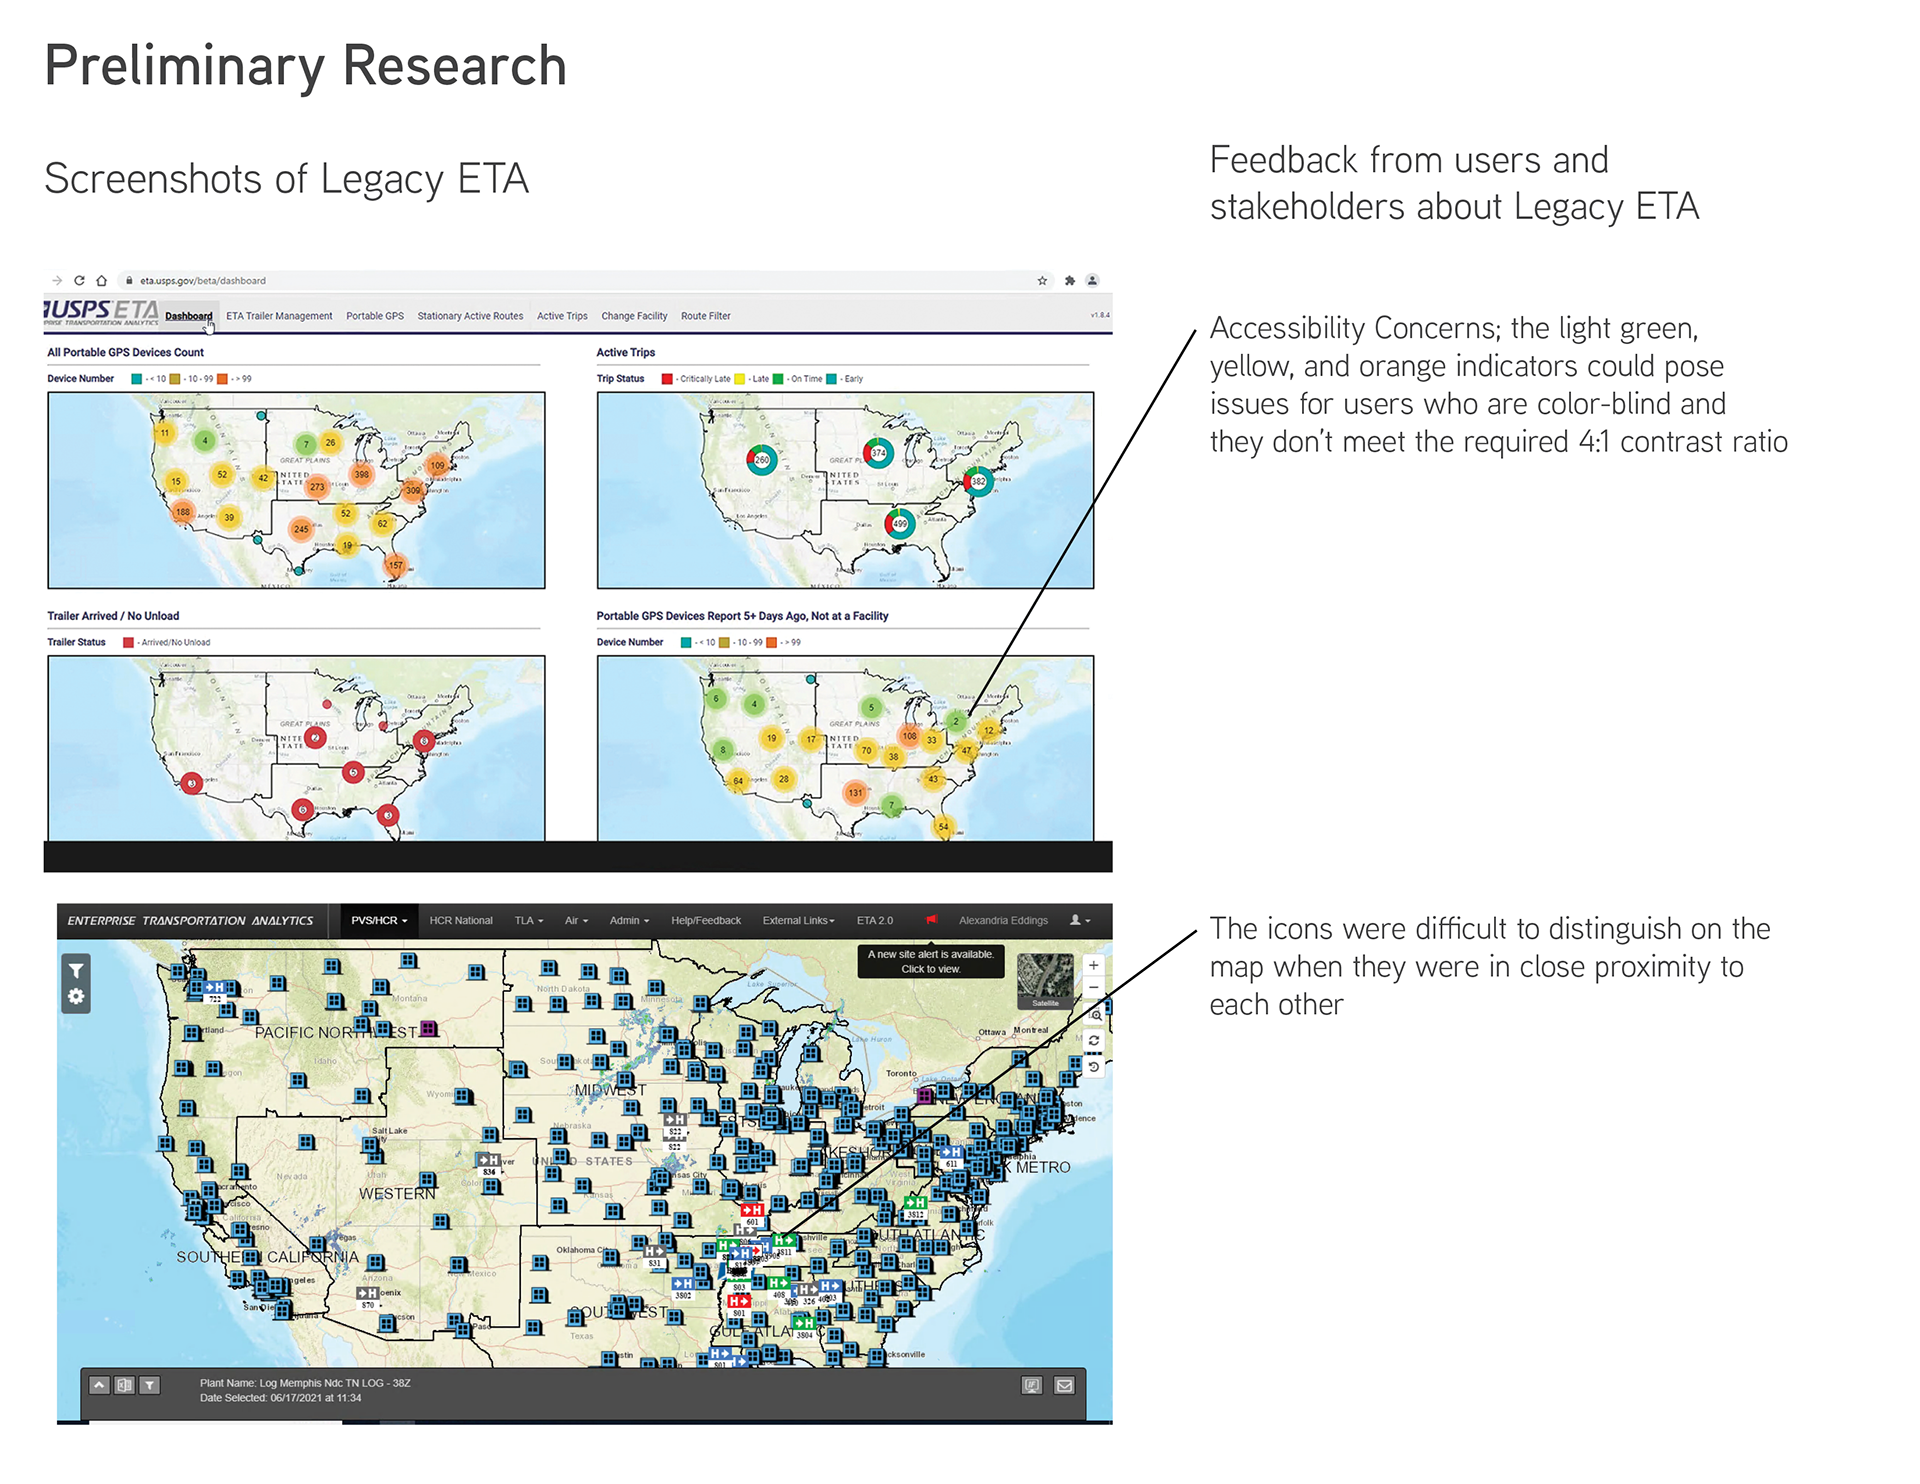
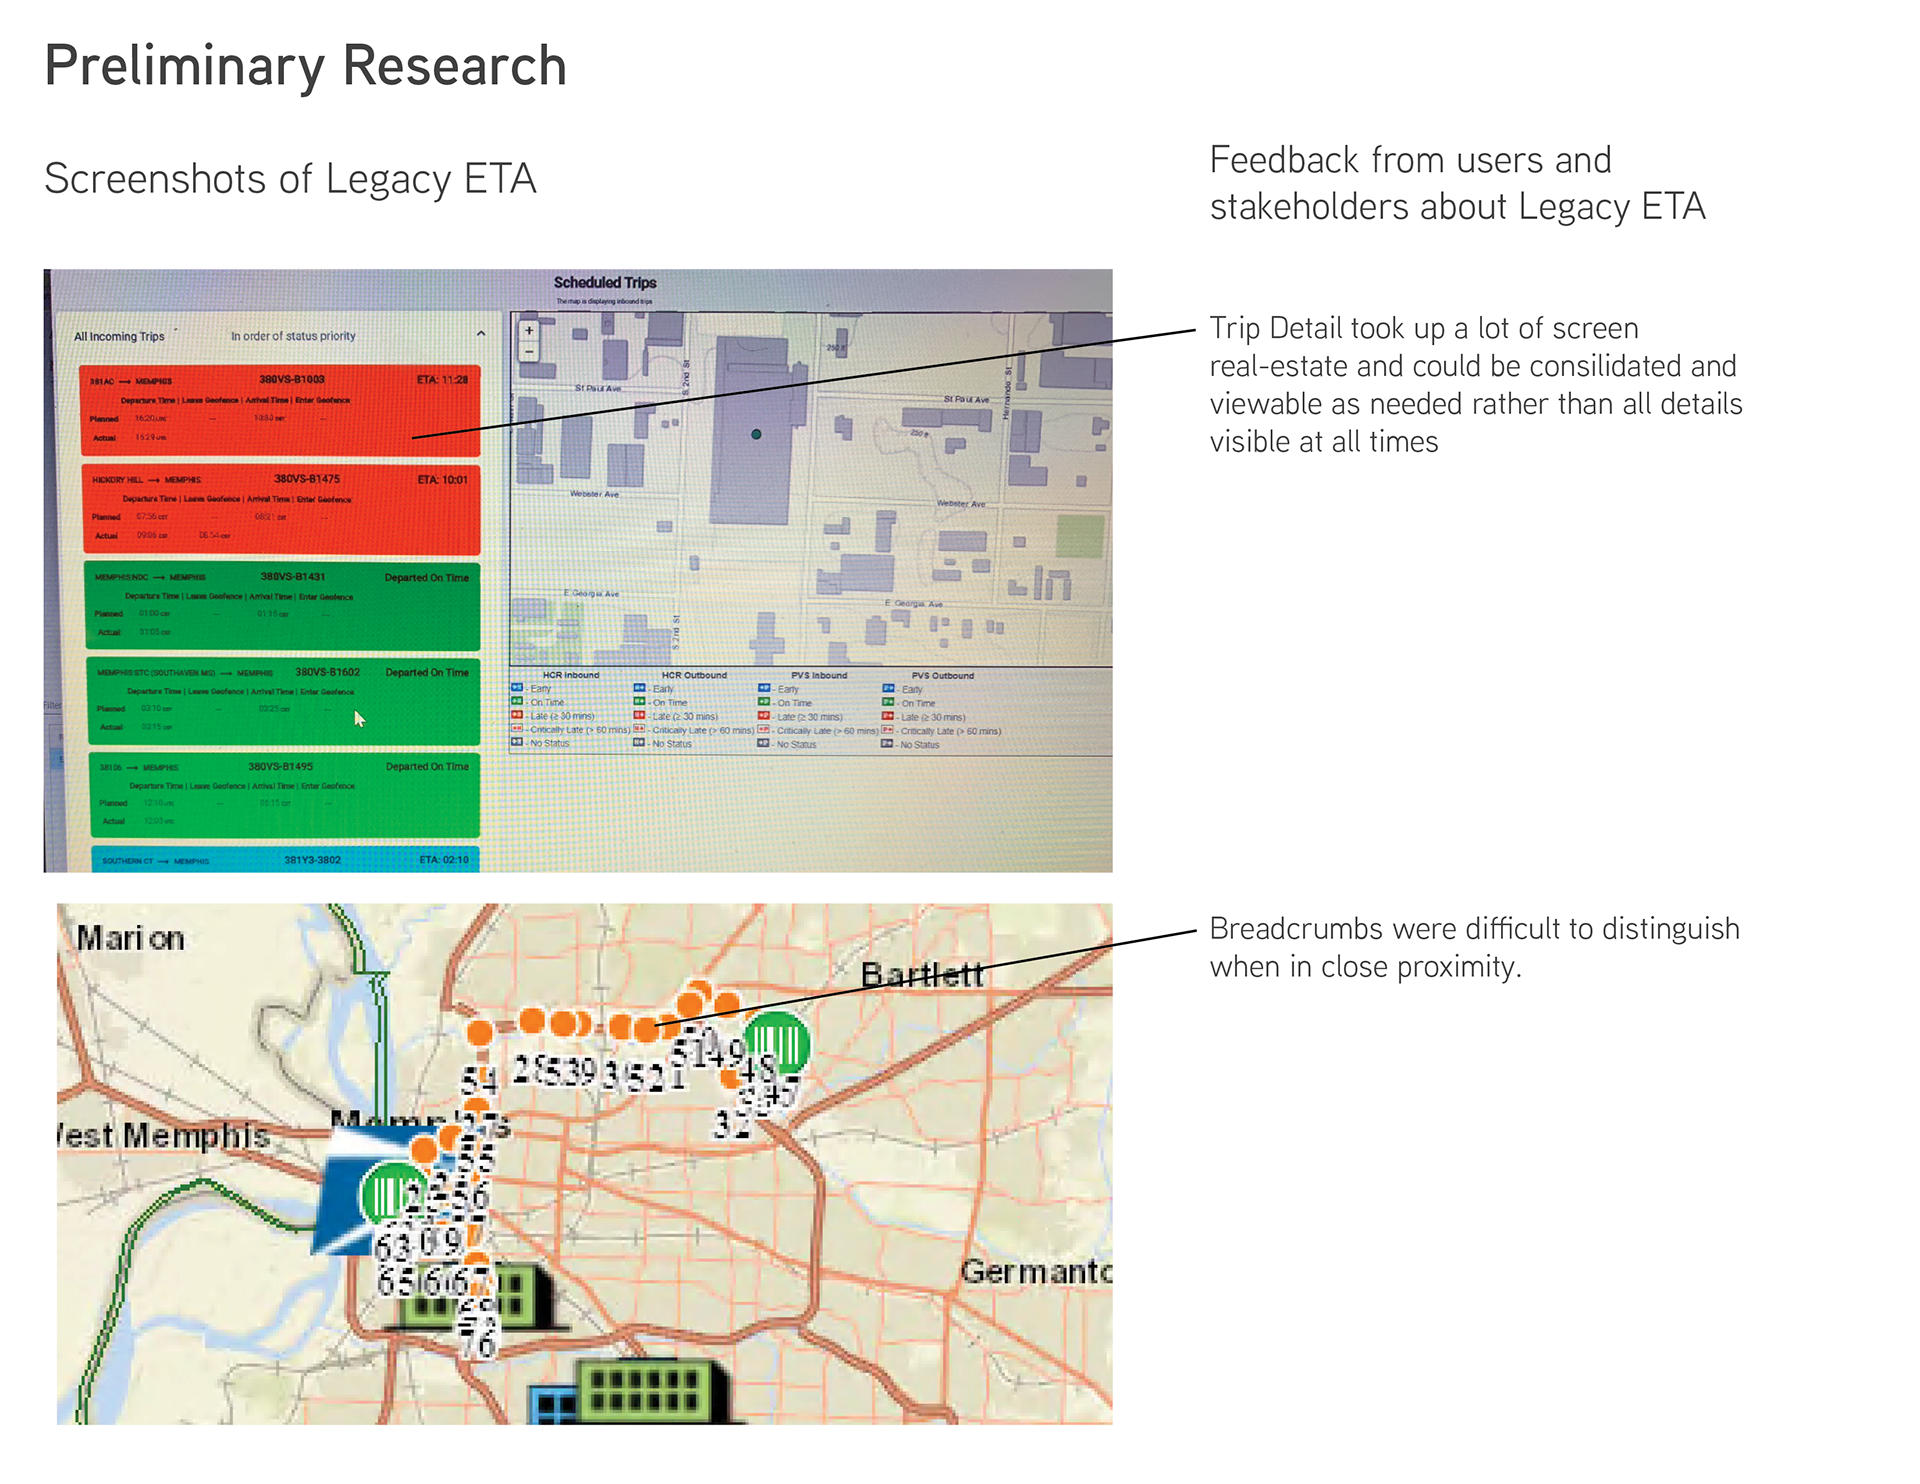
Initial Application Audit and Preliminary Research
We conducted initial audits of areas of the application to pinpoint some blatant issues as well as had some discovery sessions with users of their thoughts of how the application could be improved. See Screenshots below.
Usability Testing
We conducted three phases of usability testing fine-tuning the design after each session based on the findings and user feedback. These sessions were moderated and conducted remotely.
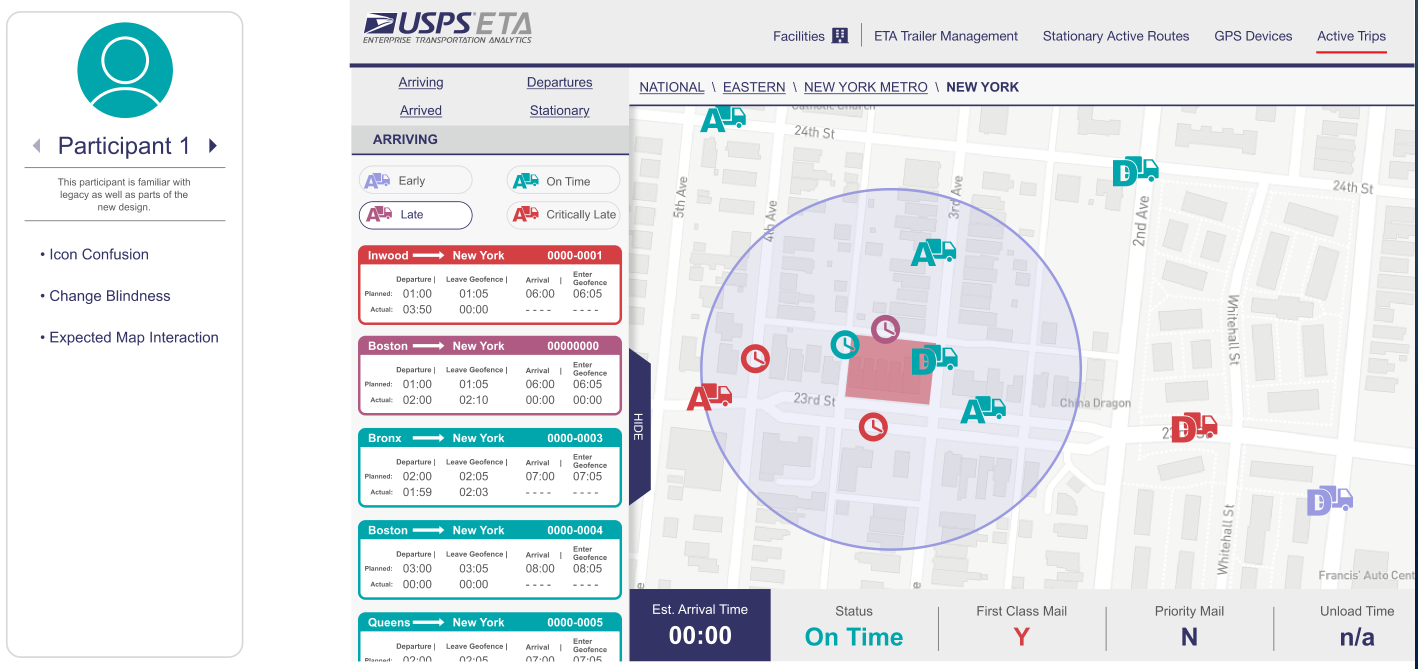
Participant 1
Icon Confusion
This session revealed confusion present with the meaning of the icons and also between word similarities such as "arrived" and "arriving"
Change Blindness
There was evidence of "change blindness" a concept were users are not aware of changes in the interfaces. This occurred with the metrics placed at the bottom of the screen
There was evidence of "change blindness" a concept were users are not aware of changes in the interfaces. This occurred with the metrics placed at the bottom of the screen
Expected Map Interactivity
Users anticipated more interactivity with the map, as it takes up most of the screen real-estate
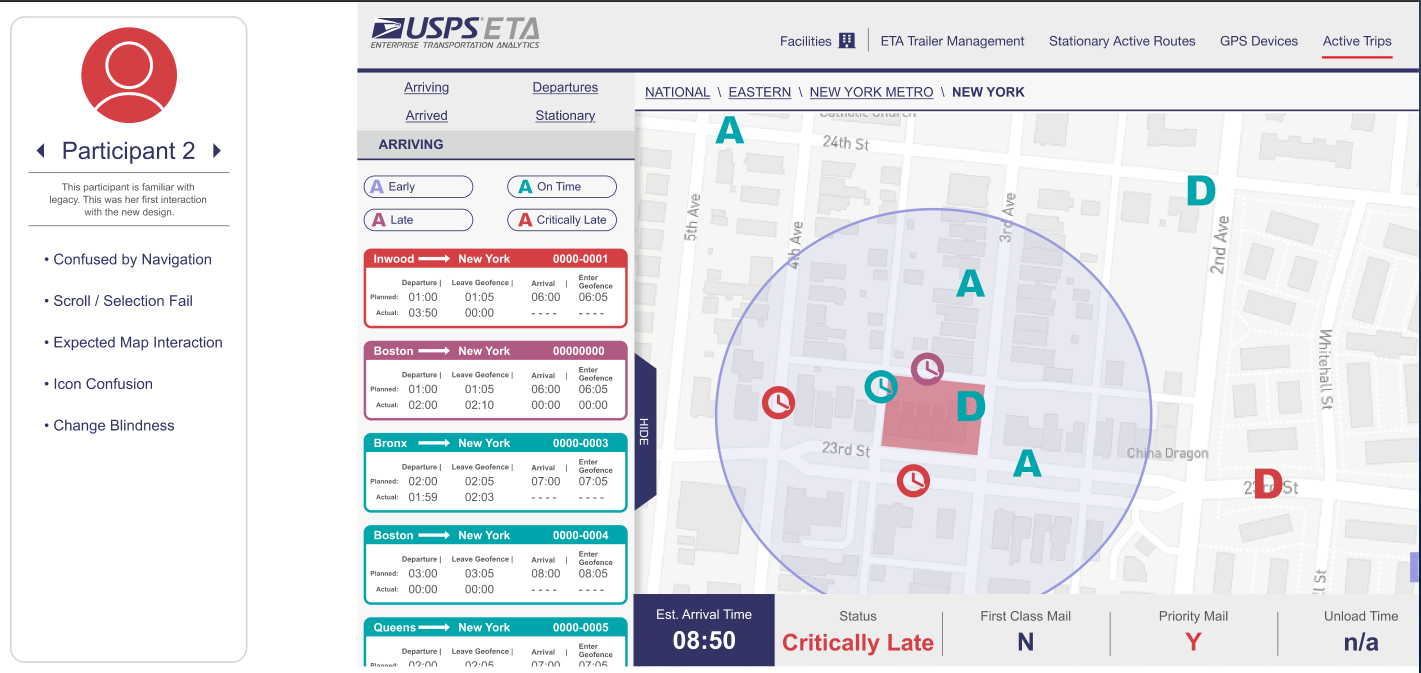
Participant 2
Icon Confusion
Confusion was still evidenced with the icons, even after making an adjustment to simplify them.
Change Blindness
The user did not notice the changing metrics below the map, which signified that this location was ineffective.
The user did not notice the changing metrics below the map, which signified that this location was ineffective.
Expected Map Interactivity
Users anticipated more interactivity with the map, specifically when clicking on the icons present on the map.
Navigation
It was not evident how to navigate the through the different types of trips in the sidebar.
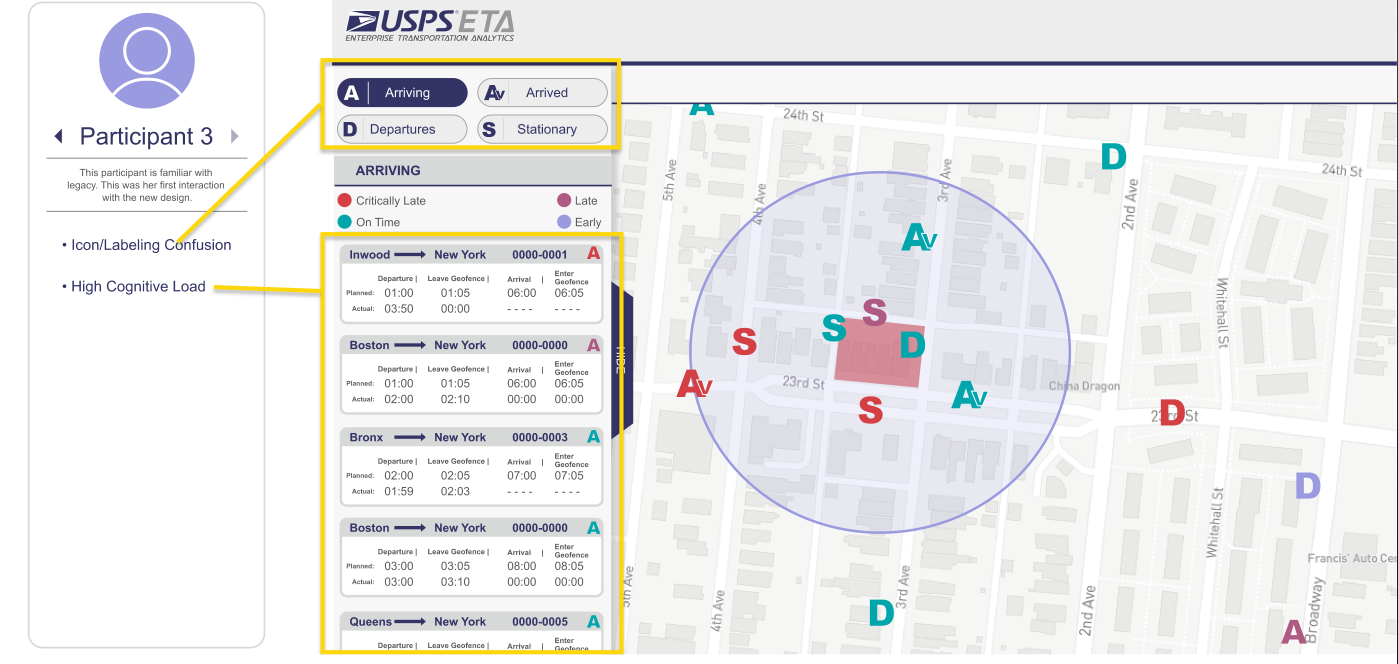
Participant 3
Icon Labeling
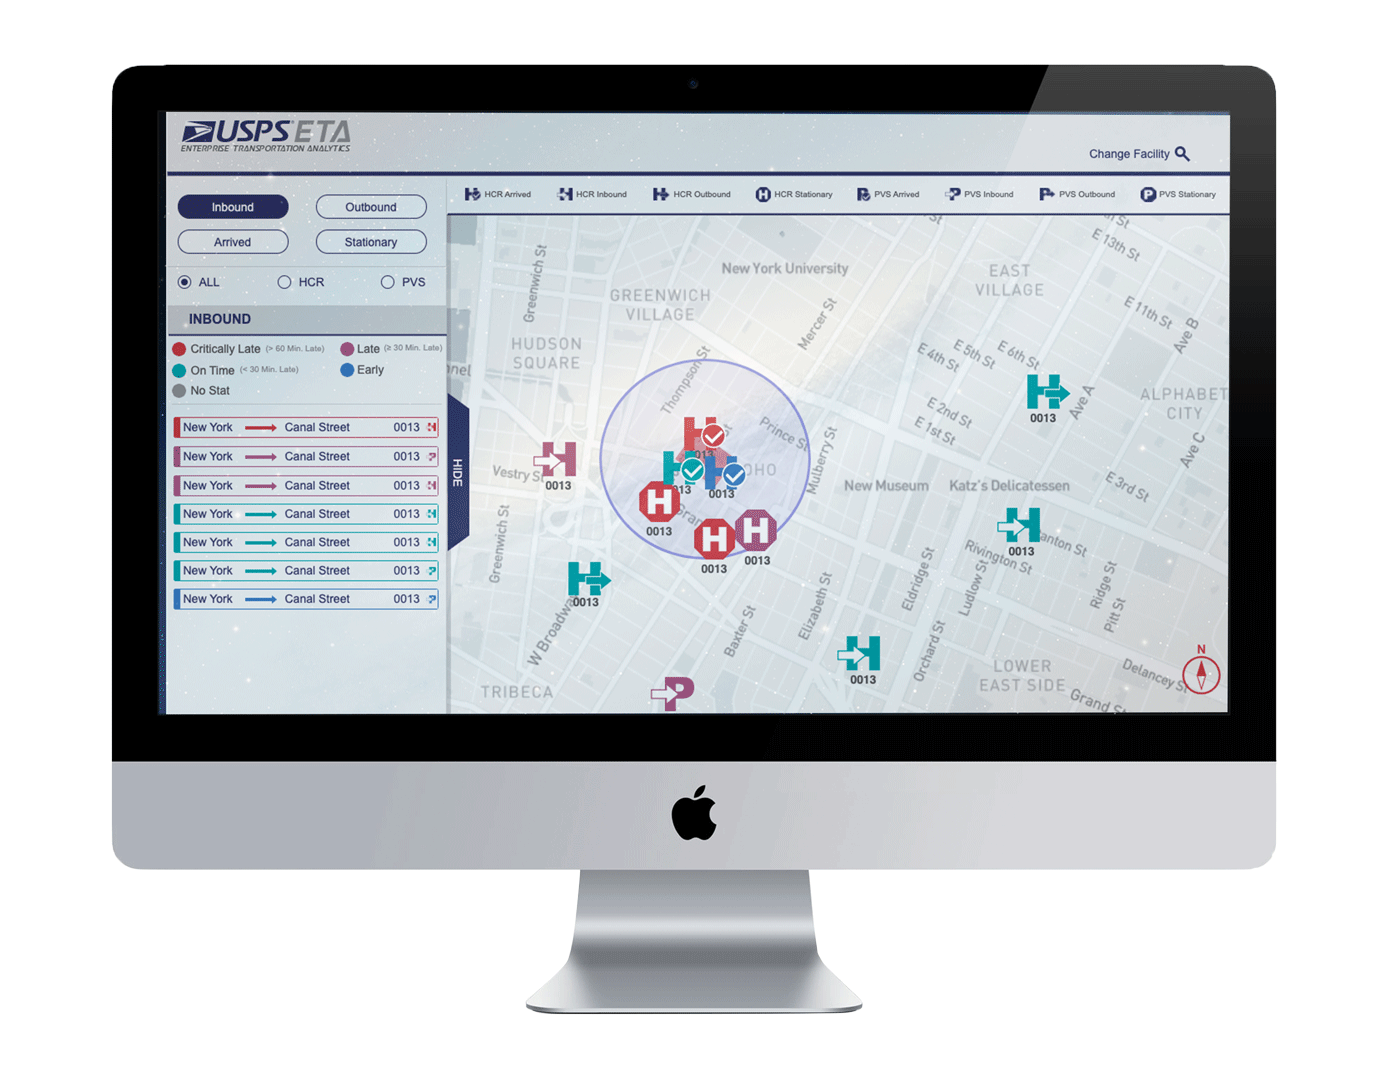
We addressed icon confusion by changing the navigation of the trip type to look like buttons, and we also included a key within the buttons.
Change Blindness
We addressed this by removing the metrics that were below the map and placing them in the trip details where users were expecting the information to be.
We addressed this by removing the metrics that were below the map and placing them in the trip details where users were expecting the information to be.
Reduced Cognitive Load
We reduced the cognitive load by removing color where it was not pertinent to meaning, which reduces the load of information for a cleaner interface.
Design Recommendations as a result of research and usability testing
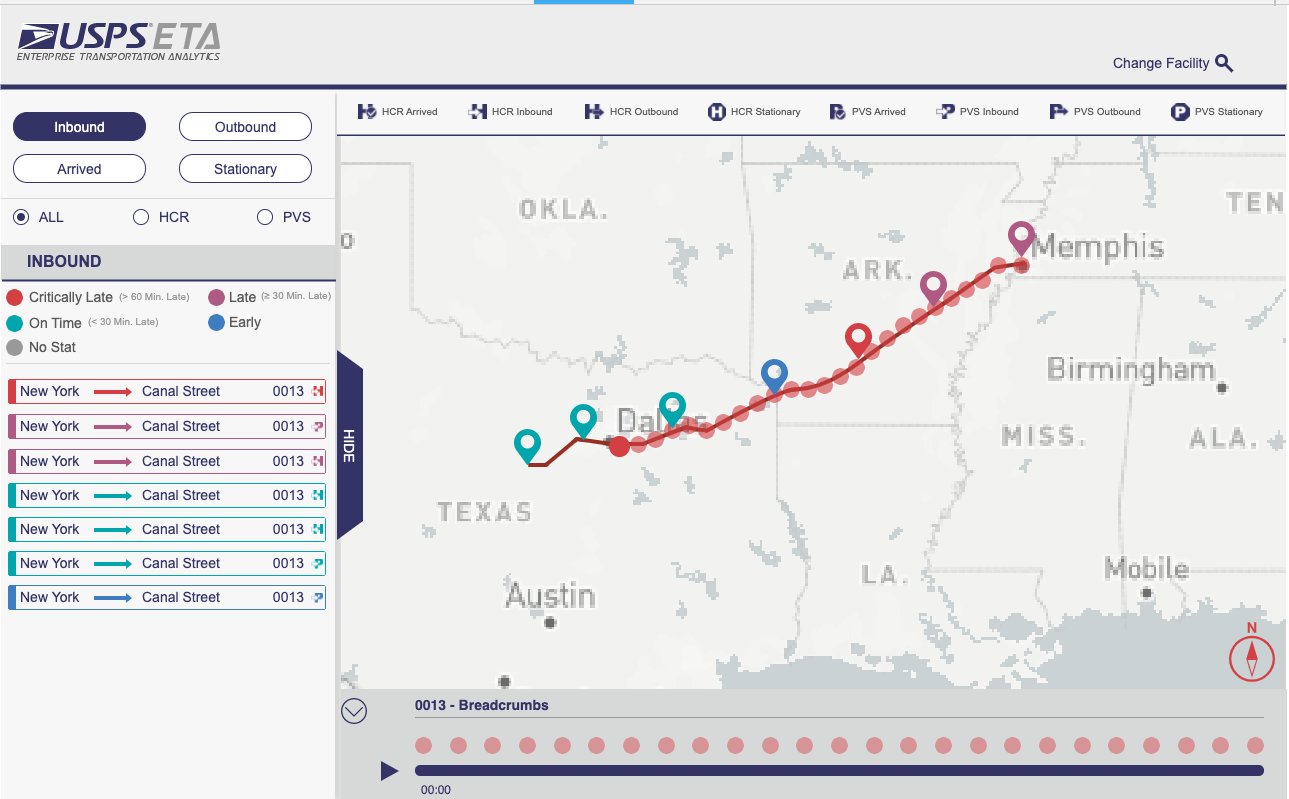
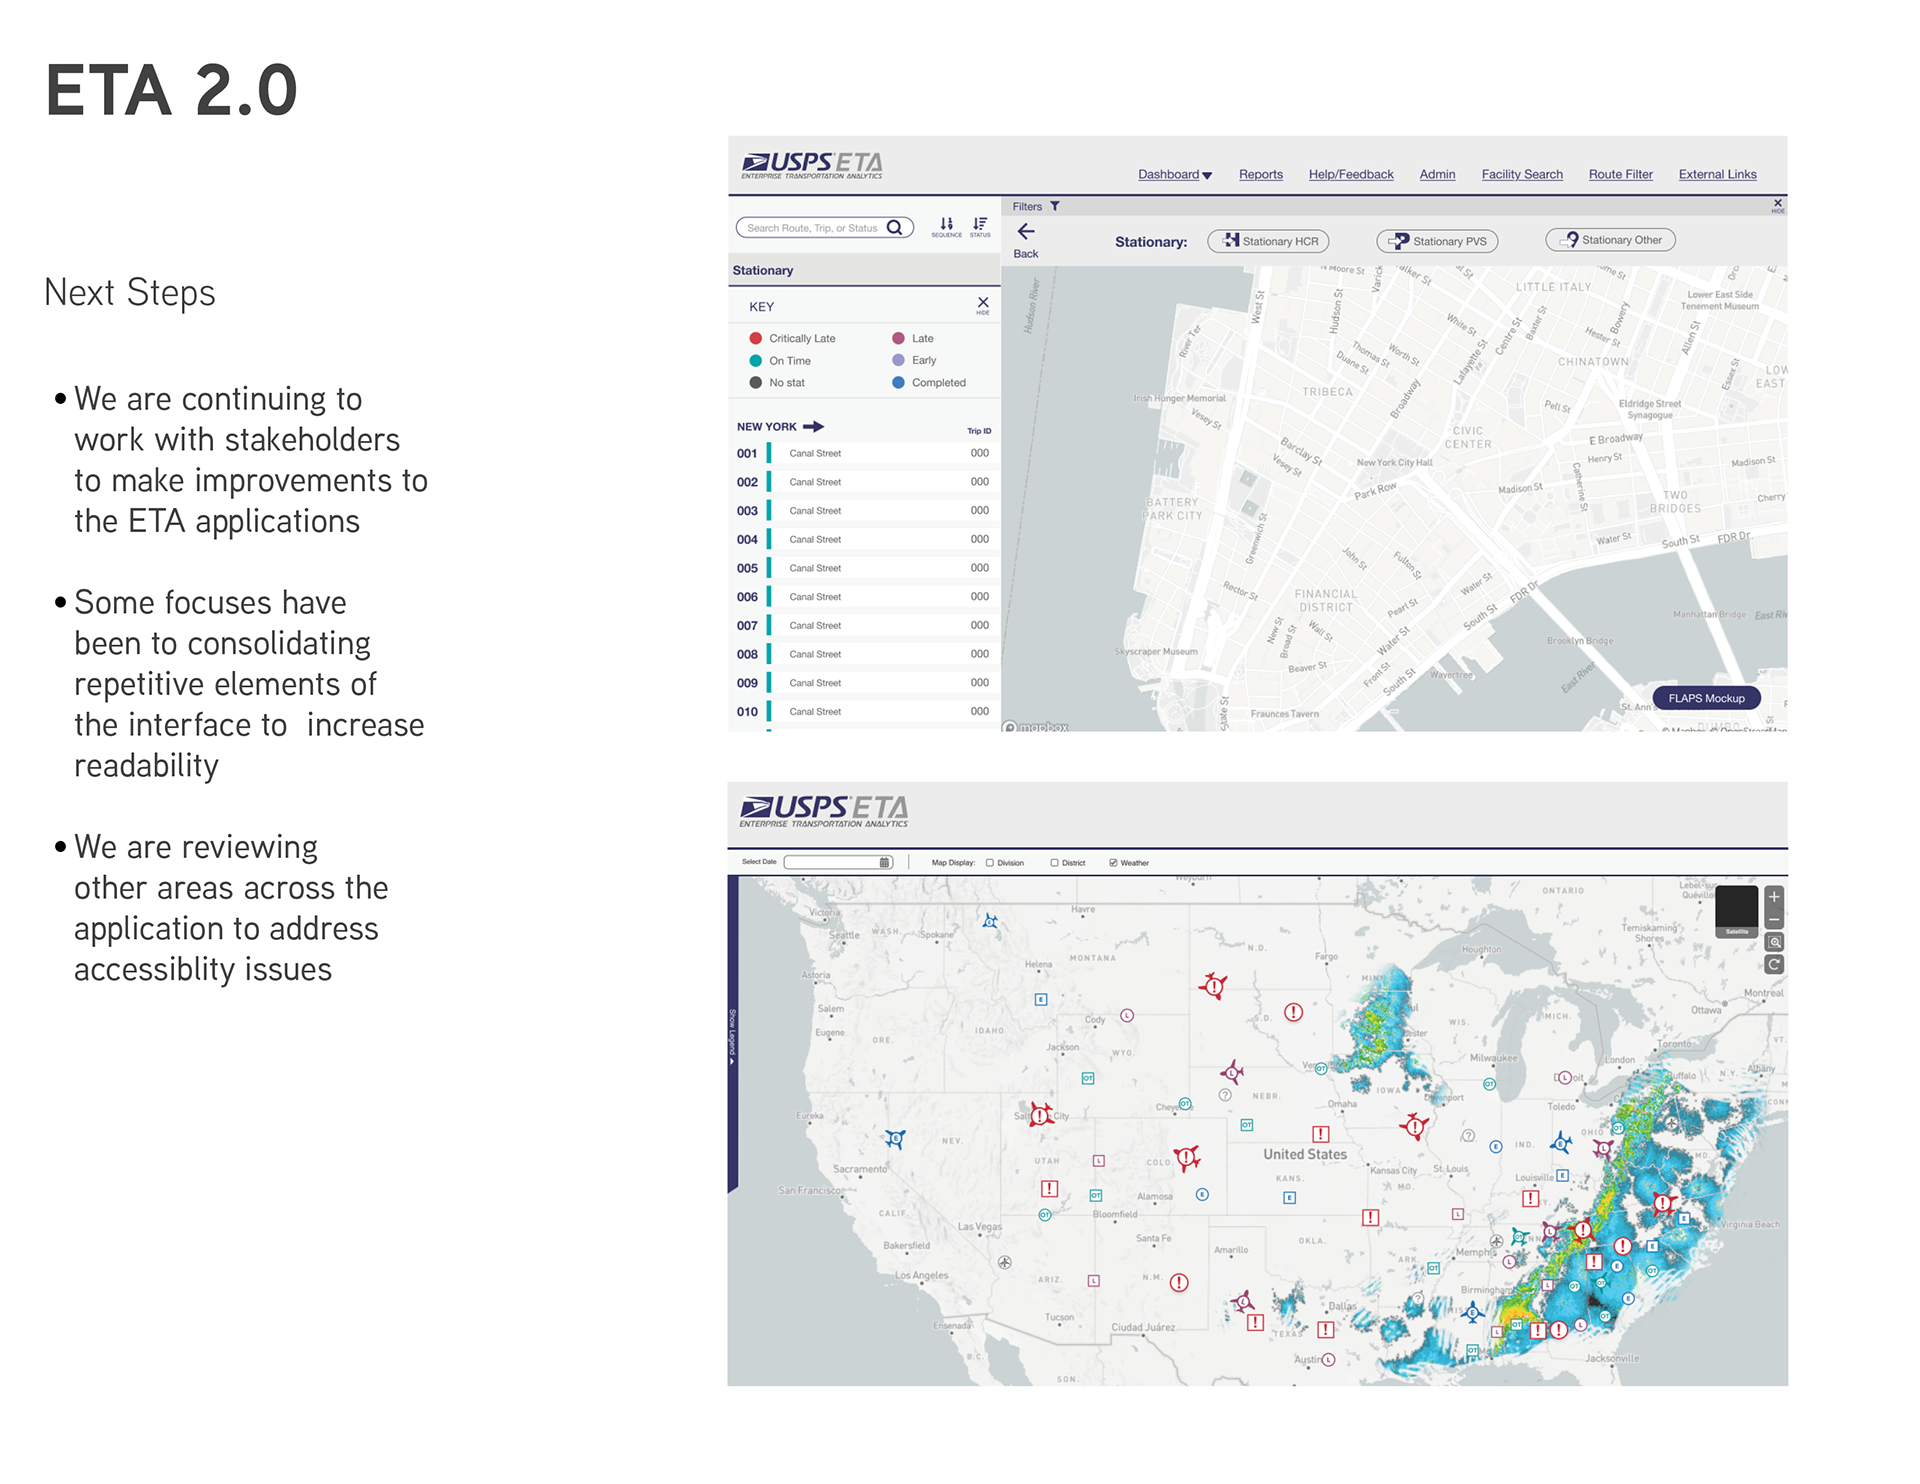
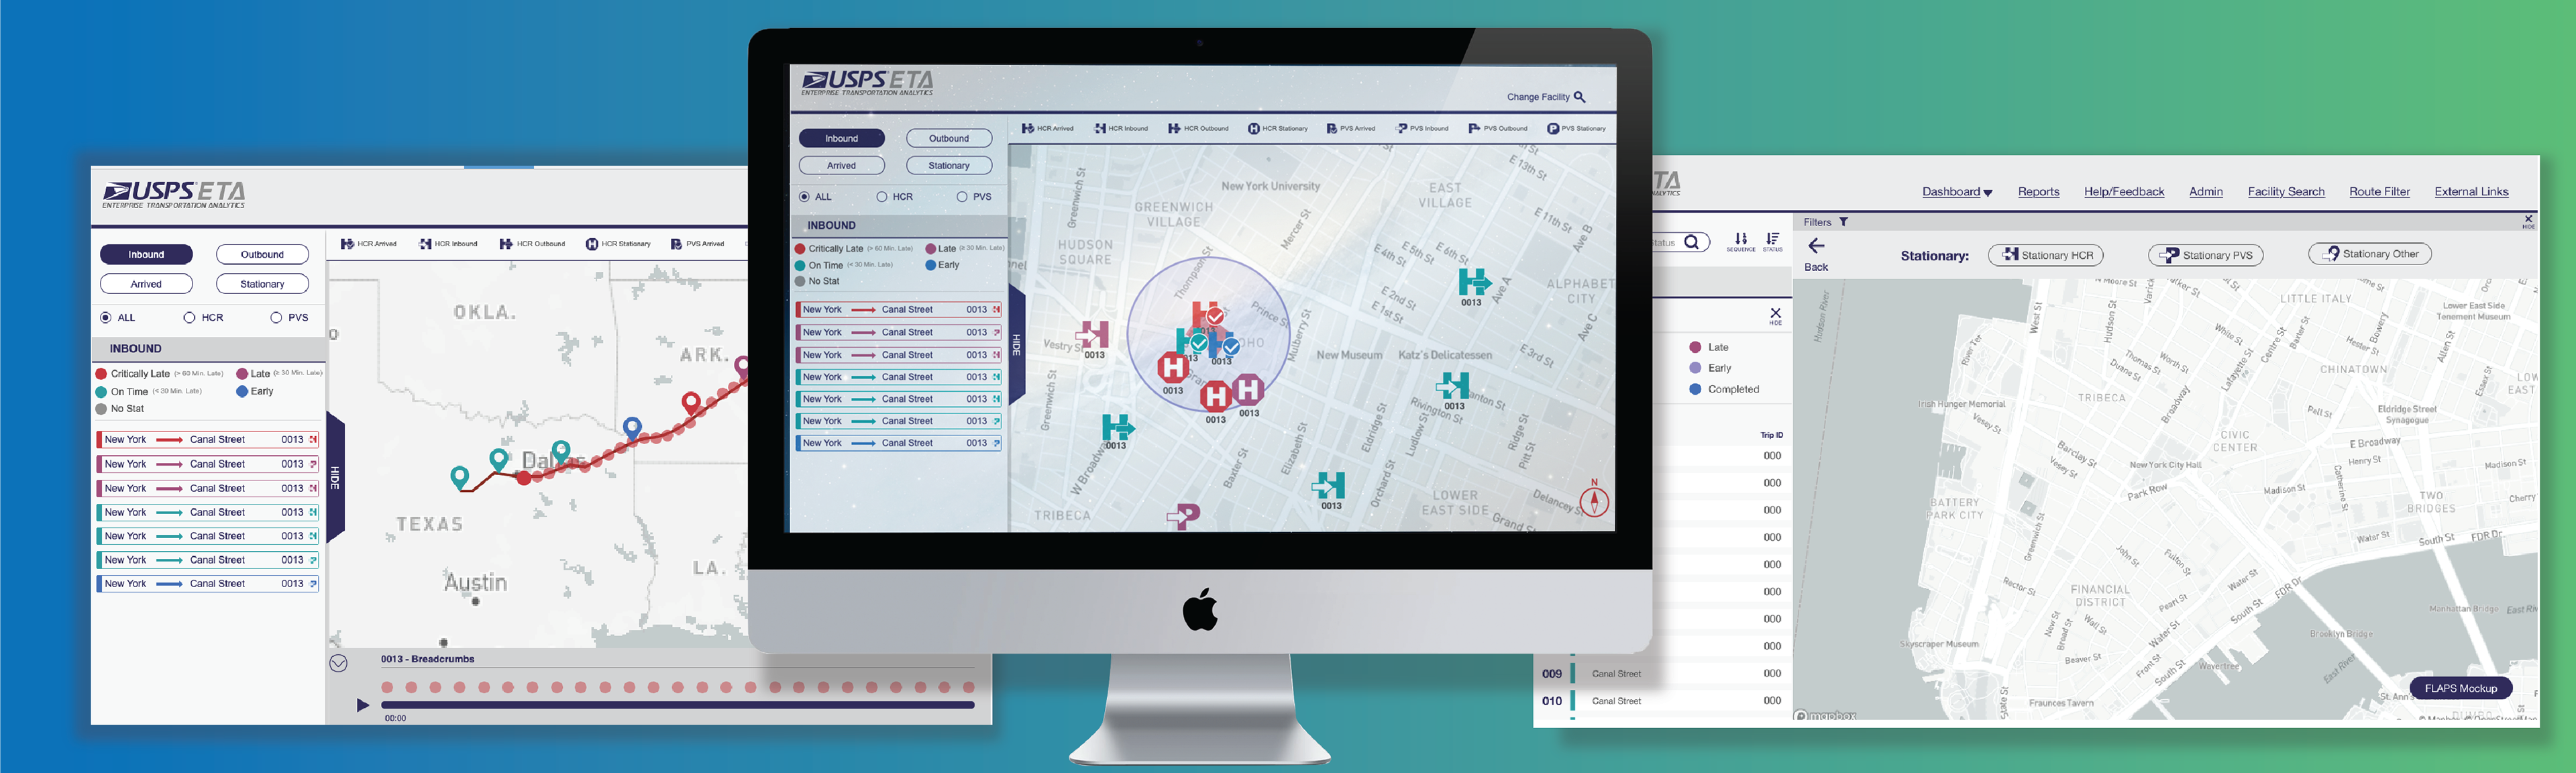
Breadcrumb Adjustments
We recommended that a timeline of breadcrumbs be accessible on the interface that is synced with the breadcrumbs on the map. This allowed for a way to clearly see each breadcrumb individually with ease.
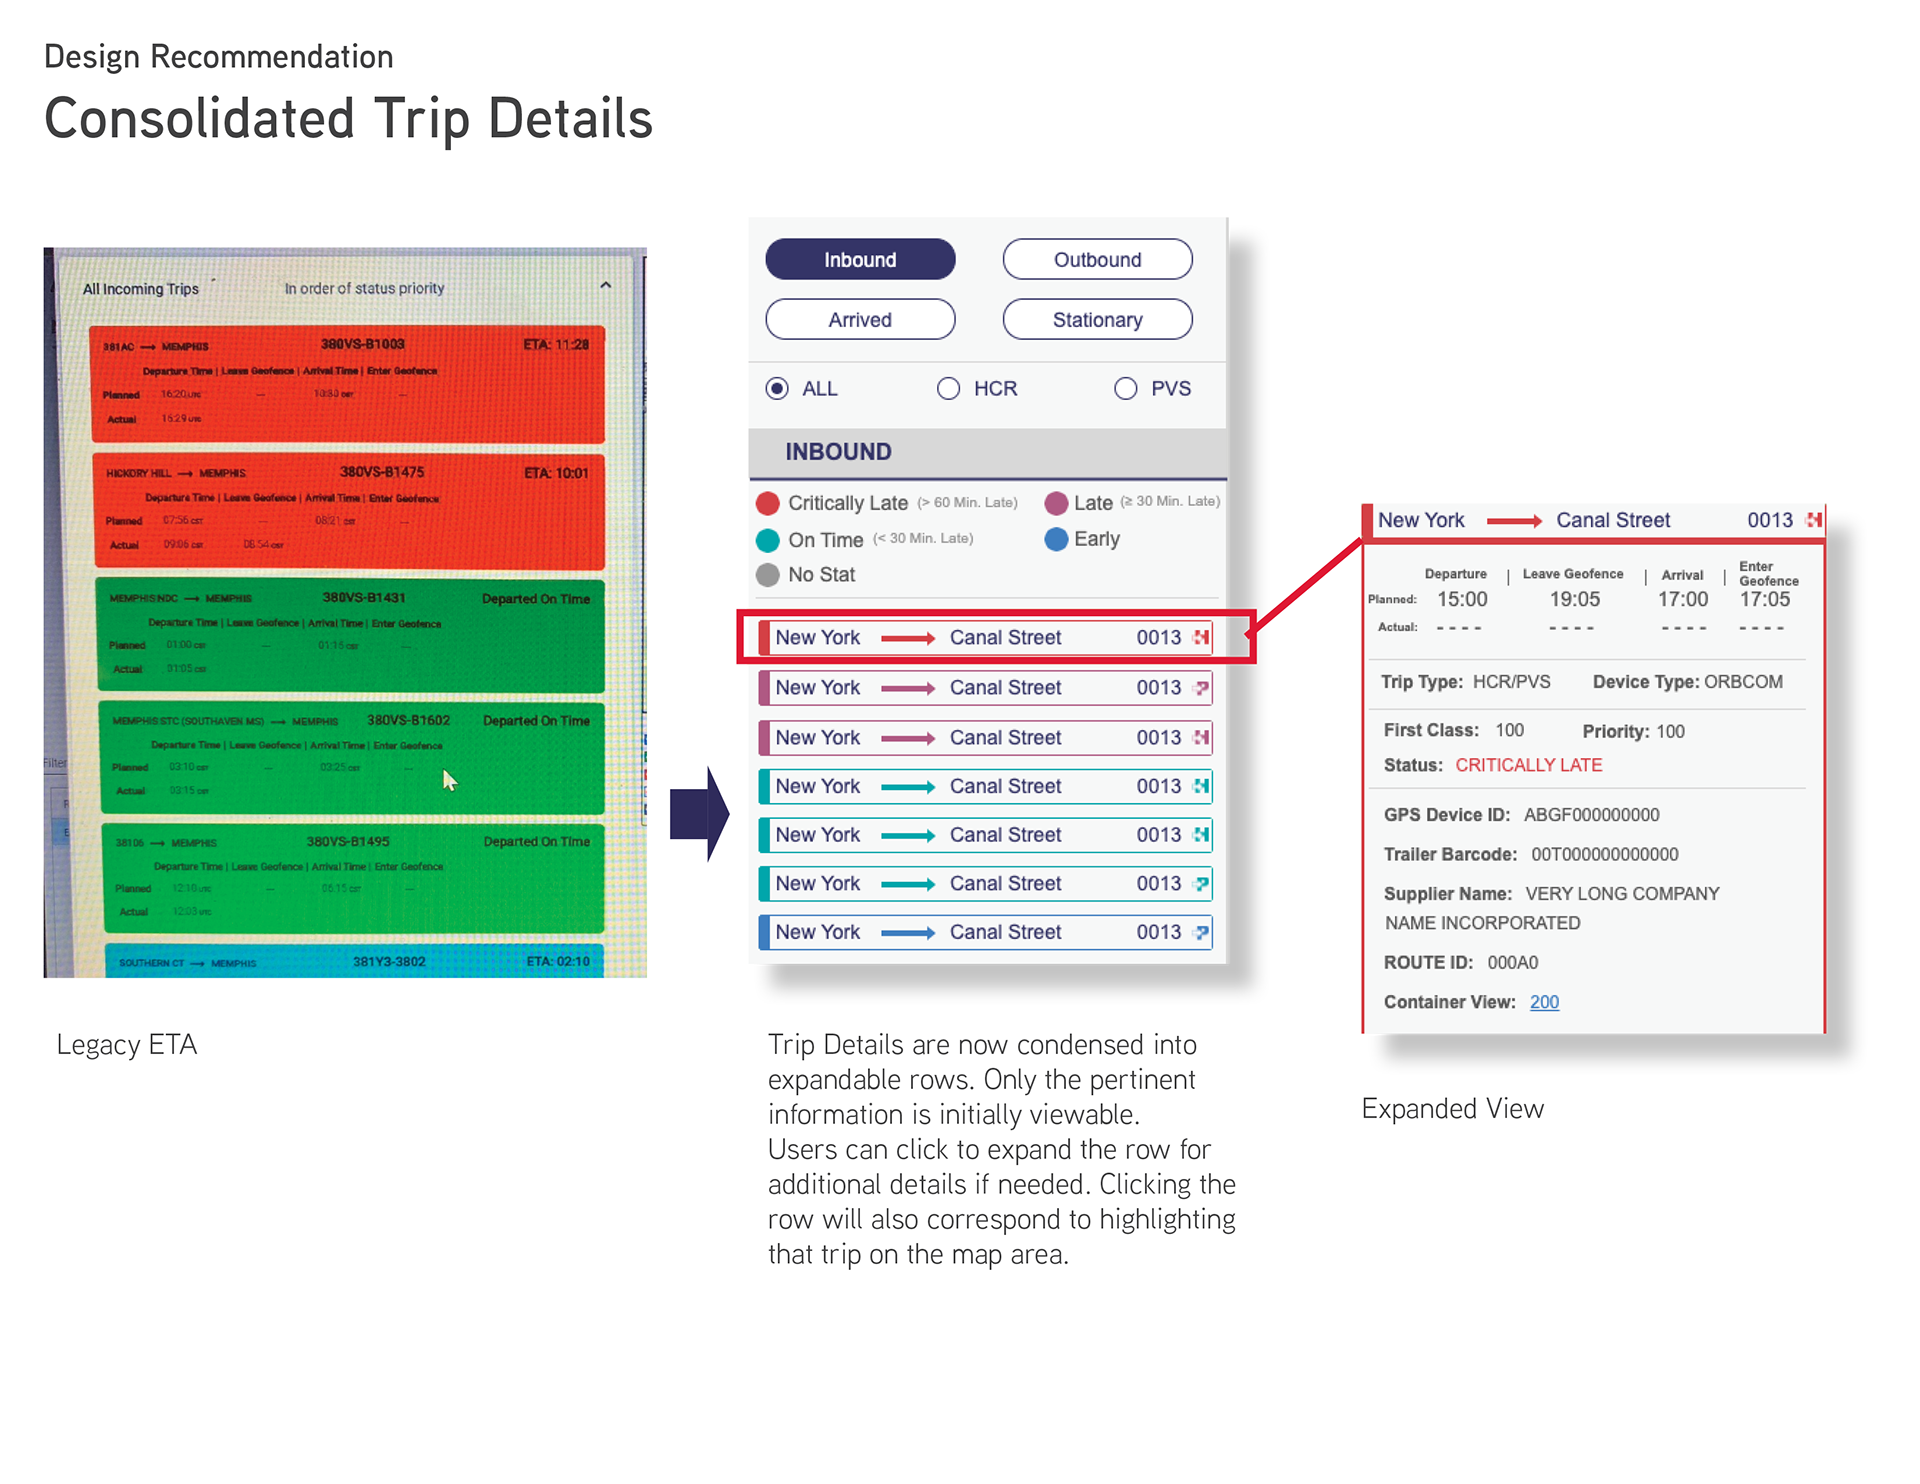
An snapshot of the expandable trip details.